Running a successful ecommerce business can feel a lot like spinning plates.
A lot of plates.
And the plates are incredibly delicate.
Plus, you keep picking up more of them.
Basically, managing a profitable ecommerce store isn’t easy.
But of all the tasks that business owners need to tackle, website measurement is often rushed, neglected, or just abandoned.
That’s because ‘digital measurement’ is an intimidating phrase that sounds complicated, time-consuming, and also a little boring. Come on. You can admit it.
Fortunately, e-commerce measurement doesn’t need to be complex.
You just need to focus on the right metrics.
And once you start tracking the right metrics, you can immediately begin to improve site performance, increase customer satisfaction, and enhance your entire e-commerce offering.
Digital measurement is sounding a little more appealing now, huh?
Let’s take a look at the 8 key ecommerce metrics that you need to be tracking to run an ultra-successful online store.
Why is measurement so important for e-commerce?
Measuring ecommerce metrics isn’t the most glamorous part of running a business.
However, it is one of the most important jobs for business owners.
Think about it.
Everything you do on a daily basis, from running paid advertising campaigns to updating product pages, is designed to achieve one goal.
To deliver positive business results and drive online sales through your website.
Your e-commerce website is where the magic happens. It’s the home of your products and the destination for your new customers.
If you’re not tracking website metrics and measuring the performance of your online store, then what’s the point of all your hard work? You’re essentially working blindly.
It’s also crucial to look beyond sales and review other ecommerce metrics.
Sales are very important, but many other metrics can be tracked to improve your business performance.
If you overlook these data points, you can miss red flags and new opportunities that can help you to increase total revenue and customer satisfaction.
What’s the difference between metrics and KPIs?
Let’s clear this up before we dive into the nitty-gritty of e-commerce measurement.
The terms ‘metric’ and ‘KPI’ are often included in the same sentences, and although they are related, they’re also very different.
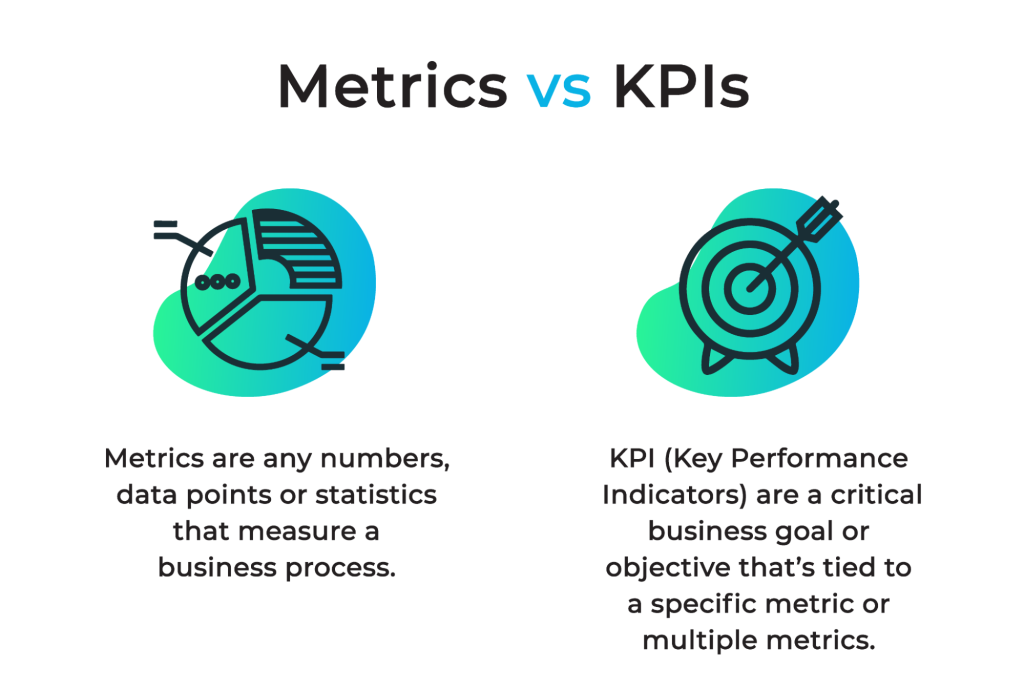
A metric is any number, data point or statistic that measures a business process.
This could be anything from social media likes to display ad clicks. A metric by itself doesn’t necessarily mean much, and some ecommerce metrics are more important than others.
KPI (Key Performance Indicators) are a critical business goal or objective that’s tied to a specific metric or multiple metrics.
When you set a KPI, you’re essentially identifying the most important ecommerce metrics for your business to track.
For example, the total number of clicks driven from paid social ads is a basic metric. The number of website conversions achieved from these clicks is an important business KPI.
See the difference?
A metric, by itself, can be almost anything.
Key Performance Indicators measure a metric that’s vitally important to your business performance.

Which metrics matter to ecommerce businesses?
Different businesses will have a slightly different perspective on key metrics – but for the vast majority of e-commerce brands, the same metrics will remain important.
A few questions need to be asked to determine the value of a digital metric.
For example:
How does this metric impact my bottom-line business results?
Does this metric help me to achieve my business goals?
Will this metric influence or positively impact other ecommerce metrics?
There’s an almost infinite number of metrics that can be tracked online.
That’s why it’s critical to focus on the metrics that matter for your e-commerce business.
Luckily, you’re in the right place.
Below are 8 e-commerce website metrics that are essential to success. If you can monitor these metrics closely, you’ll be on track to significantly improve website performance.
8 key e-commerce website metrics you need to track
Not every digital metric will have the same impact on your business.
Some metrics may be more useful to track in the short term, and others more valuable in the long term.
However, tracking all of the online metrics listed below will ultimately help you to create a more efficient and profitable ecommerce website in the long run.
Ecommerce Metric 1 – Conversion Rate
The conversion rate is one of the most important ecommerce metrics for e-commerce businesses to monitor.
Fortunately, it’s also one of the simplest to calculate.
To calculate your site conversion rate, just divide the number of conversions achieved in a specific time frame by the number of visitors to your website, and multiply by 100.
The number you’re left with is your conversion rate percentage. Easy.
Your conversion rate highlights how efficient you are at transforming clicks and site visitors into sales.
This may go without saying, but the higher your conversion rate, the better.
So what does a ‘good’ conversion rate look like? Well, it varies by industry, but a positive e-commerce conversion rate falls somewhere between 2-4% on average.
However, although calculating your conversion rate is easy, improving it is a different story.
Various factors can impact the efficiency of your conversion rate, and you may need to optimise several areas of your website to drive a significant improvement, including:
- Streamlining your checkout processes
- Improving the loading speed of product pages
- Strengthening your CTA copy and placement
- Adding social proof and testimonials to your product pages
- A/B testing different headlines
- Testing pop-ups and special offers
There’s no ‘silver bullet’ to improve your conversion rate, but ensuring that you’re converting as many site visitors as possible is absolutely crucial.
Calculate your conversion rate on a regular basis, and if your website is becoming less efficient, act quickly.

Ecommerce Metric 2 – Customer Lifetime Value (CLV)
Your business can’t function without customers purchasing your products.
No surprises there, right? More customers, more revenue.
But calculating the precise value of your customers is also a very important exercise.
This process involves a metric known as Customer Lifetime Value (CLV).
To calculate the lifetime value of your repeat customers, just follow the steps below.
1. Calculate the Average Purchase Value for your business – divide the value of all customer purchases in a certain time frame by the number of purchases in the same period.
2. Calculate the Average Purchase Frequency for your business – divide the number of purchases in the same time frame by the number of individual customers who made them.
3. Calculate your total Customer Value by multiplying your Average Purchase Value by your Average Purchase Frequency.
4. Finally, calculate your Customer Lifetime Value by multiplying Customer Value by your Average Customer Lifespan.
Phew.
Calculating CLV is a little bit fiddly, but once you’ve completed the calculation once, it’s much easier to repeat in future.
Once you’ve followed these steps, you’ll be left with a final Customer Lifetime Value.
Why is calculating CLV so useful for e-commerce businesses?
There are a couple of reasons.
Firstly, calculating CLV allows you to accurately determine how much you can spend on acquiring new customers.
Once you know how much the average customer is worth to your business, you can quickly calculate a healthy Cost Per Acquisition.
Figuring out your CLV can also help you to identify higher-value repeat customers, which informs your acquisition marketing efforts and customer retention priorities.

Ecommerce Metric 3 – Website Traffic
Measuring website traffic in isolation isn’t necessarily the most insightful exercise.
It’s interesting to understand how many users are visiting your website on a daily, weekly, or monthly basis – but how does this impact your sales and revenue?
The amount of traffic you’re driving can have a major impact on other key ecommerce metrics.
Namely, your conversion rate.
It’s fairly simple. Let’s say you’re currently achieving a 5% sales conversion rate with an average of 2,000 site visitors per week. That’s 100 weekly conversions.
But what if your traffic was to increase to 4,000 site visitors per week?
Now you’re likely to be delivering upwards of 200 weekly conversions.
The more traffic you drive to your website, the more opportunities there are to drive conversions.
Now, obviously the relationship between traffic and conversion rates isn’t that straightforward.
You can’t just drive millions of low-quality clicks and expect your ecommerce conversion rate to remain consistent.
But it is true that monitoring and increasing your traffic is key to boosting sales and improving conversion rate optimization.
It’s also crucial to accurately measure the sources of your website traffic, and figure out which channels (e.g. paid search, paid social) are ultimately delivering the most valuable clicks and conversions.
If paid social advertising is driving more traffic that results in conversions than display advertising, you can shift your marketing budget accordingly.

Ecommerce Metric 4 – Average Order Value
Tracking the number of customers who purchase from your website is important, but it’s also crucial to measure the value of each individual purchase.
This is where the Average Order Value (AOV) metric can come in handy.
To calculate your website AOV, just divide your total revenue (from a certain time frame) by the total number of orders from the same period.
You can also think of your Average Order Value as the average value of an individual conversion.
Tracking your Average Order Value allows you to set benchmarks that can inform your marketing efforts.
For instance, AOV can help you to estimate how much revenue will be generated from a certain number of customers based on your sales conversion rate.
You should also measure AOV over time to ensure that you’re gradually increasing the value of each website conversion.
Increasing the volume of sales you’re driving is a surefire way to boost revenue, but you should also be aiming to maximise the value of each conversion.
To consistently improve your AOV you can utilise a few different marketing strategies, including:
- Using upselling and cross-selling tactics to encourage users to add more products to their basket
- Selling product bundles or packages at a slight discount to entice customers into buying additional items
- Offering free shipping or gift items above a certain spend threshold to encourage a higher basket value
Using these tactics can rapidly increase the value of your average orders, which means more revenue is being driven from existing customers.

Ecommerce Metric 5 – Customer Acquisition Costs
Increasing the number of new customers purchasing from your online store is obviously a priority for any e-commerce business.
Metrics like Average Order Value and Customer Lifetime Value are vital, but it’s also important to take a step back and review how much it costs to acquire these new shoppers.
By calculating your Customer Acquisition Cost (CAC) you can ensure that you’re spending your marketing budget efficiently and maintaining profitability.
Your CAC (also known as your Cost Per Acquisition) highlights how much it’s costing your business to attract and convert a new customer.
It takes into account all of the costs involved with a new acquisition, including all marketing and sales expenditures.
For example, let’s say that your online business has the following annual marketing and sales costs:
- Staff salaries – £100,000
- Paid social advertising – £10,000
- Display advertising – £10,000
- PPC advertising – £15,000
Your total marketing expenses would amount to £135,000. Now let’s say that you’ve acquired 1,500 new customers in the last year. Time to calculate the CAC.
By dividing £135,000 (marketing costs) by 1,500 (new customer total) you’re left with your overall Customer Acquisition Cost. In this case, you’re spending £90 per acquisition.
The CAC metric is also directly tied to your Average Order Value.
The higher your AOV, the more you can afford to spend on customer acquisition while maintaining profitability.
Makes sense, right?
It’s also useful to calculate CAC by source, as some advertising channels (e.g. paid search) will be more effective than others and generate a superior ROI.
You can use this data to shift marketing budgets and improve efficiency.

Ecommerce Metric 6 – Email Opt-In Rate
Email marketing is hugely popular with ecommerce businesses in all industries.
That’s not surprising when you consider some of the statistics surrounding email campaigns.
Marketers using segmented email campaigns have seen as much as a 760% increase in revenue, while brands that regularly A/B test emails generate an ROI of 40:1.
Those are some seriously compelling numbers for e-commerce brands.
But what do email campaigns have to do with ecommerce metrics?
The short answer is that you should be frequently capturing customer email data and running email campaigns, while also carefully tracking your Email Opt-In Rate.
The slightly longer answer is that email advertising is extremely versatile, and the higher your Email Opt-In Rate, the more chances you have to increase customer loyalty.
Email marketing is particularly effective at strengthening long-term customer loyalty.
You can regularly contact your customer base, communicate directly with your most profitable segments, and use email content to distribute information or drive actions.
Not every email needs to deliver a direct conversion, but email marketing keeps customers engaged, loyal, and interested in your online business. If you’re struggling to maintain or improve your Email Opt-In Rate, you’re missing revenue opportunities – it’s as simple as that.
If you need to kick your Opt-In Rate in the right direction, you can try a few tactics to boost subscriber numbers and engagements:
- Offer a special discount or loyalty programs to new email subscribers
- Add tactical pop-ups to your website to capture email data
- Test out different CTAs to determine the best for email subscriptions

Ecommerce Metric 7 – Shopping Cart Abandonment Rate
Not every customer who adds an item to their online cart will make a purchase.
That’s just a fact of life. A slightly inconvenient fact, but a fact nonetheless.
In fact, the average Shopping Cart Abandonment Rate for all e-commerce industries is 69.57%, meaning roughly 7 in every 10 shoppers will leave your site before buying a product.
However, you can take steps to reduce the number of shoppers who abandon their carts and increase the number of successful website conversions.
A huge part of this process involves regularly measuring your Cart Abandonment Rate.
Ideally, you should see this average number decrease over time.
Even if a large number of customers continue to abandon their cart, if you can recover a small percentage of these sales, you can still significantly increase annual revenue.
To consistently improve your Cart Abandonment Rate, you should:
- Be fully transparent about additional costs at checkout (shipping costs, transaction fees, etc)
- Create a smooth, convenient, and fast-loading experience between your ecommerce store and the checkout
- Provide guest checkout options (if possible) for convenience
- Utilise trust badges to improve customer confidence and trust
- Offer multiple payment options to facilitate easier conversions
Once you’ve put some of these adjustments into action, be sure to keep track of your Cart Abandonment Rate over time.
If you ever see abandonments increasing, it’s probably a sign that there’s an issue that needs resolving!

Ecommerce Metric 8 – Bounce Rate
The world of e-commerce moves incredibly quickly, particularly for shoppers hopping between websites.
With so many brands and products available at the click of a button, you must capture as many prospects as possible once they’ve landed on your website.
Time is of the essence.
You don’t have long to grab customer attention, and a technical error or design flaw can make the difference between a new customer and lost revenue.
That’s why consistently measuring your website Bounce Rate is crucial for the long-term success of your online business.
Your Bounce Rate indicates the number of users who view a single page on your website and then leave without any further clicks or interactions.
As with many ecommerce metrics, your Bounce Rate will differ based on your industry and business model – but an average e-commerce Bounce Rate falls between 20-45%.
If your Bounce Rate is concerningly high, there’s probably a critical error that needs addressing. And fast.
Testing your website landing page experience (either manually or through a third-party service) is a smart move, to understand if there’s something glaringly obvious that’s causing users to leave.
If a shopper has exited your website because of a particularly irritating issue, they could be lost forever, so it’s vital that you address any problems quickly and effectively.
If you’re looking for ways to improve your Bounce Rate, you could try to:
- Reduce the page loading speeds on your website
- Identify and fix any obvious usability issues (e.g. technical glitches, mobile device optimisation problems, etc)
- Refine landing page copy to grab attention and drive action
- Improve your landing page design (e.g. eye-catching graphics, professional look and feel)

All of these metrics play an important role in running a profitable and successful ecommerce store.
Some may seem more immediately important than others, but if you can consistently monitor all of these metrics, you’ll build a crystal clear picture of your store’s performance.
The key here is consistency.
Don’t neglect any of these ecommerce metrics or focus too strongly on a single data point.
It’s much easier to fix potential issues if you identify the symptoms early! Trying to claw back lost revenue and failed conversions is much trickier than pre-empting problems.
How should I use all of this data?
To make the most of your website data, make sure that you’re not just gathering the numbers and leaving them to collect dust.
Ecommerce website data is only useful if it’s used to fuel actions and inform your marketing strategy.
Use all your website data to identify opportunities for improvement and increased sales.
For example, if you’re seeing a high Cart Abandonment Rate, a few tweaks to the customer experience can make a huge difference to your revenue.
If you’re noticing a high Bounce Rate on your landing page, adjustments to your website design and copy can retrieve conversions that would otherwise have been lost.
Many areas of your website can be quickly optimised, but only if you’re carefully tracking these ecommerce metrics and keeping an eye on customer trends.
Measuring these metrics enables businesses to drive value in both the long term and the short term.
While long-term metrics (e.g. Email Opt-In Rate) can increase revenue over time, short-term metrics (e.g. Conversion Rate) can have an immediate and noticeable impact.

How is ecommerce site performance measured?
Now that you’re up-to-speed with some of the most useful ecommerce metrics to track, let’s look at how you can measure them effectively.
The first thing to consider is the tools you’ll be using to collect and analyse data.
Google Analytics is a fantastic place to get started with website measurement.
Through the Google Analytics tool, you can measure a huge number of important metrics, from Conversion Rates to Bounce Rates. The platform is also easily accessed and simple to navigate, making measurement a breeze for business owners.
However, over time you may want to incorporate more tools into your measurement arsenal beyond Google Analytics.
Some platforms offer highly specific services (e.g. automated A/B testing, user heatmaps) that can help you to make even more informed decisions about your store’s performance.
It’s also crucial that you establish a solid reporting routine to measure ecommerce success.
That means setting key milestones on a weekly or monthly basis for reporting. Not every metric needs to be viewed at the same time, but just make sure that you’re maintaining a clear view over every area of your website.
Setting clear benchmarks is also extremely useful when you’re optimising ecommerce site performance.
Without benchmarks or targets to aim for, it’s difficult to know if you’re making sufficient improvements to your website.
Making a note of your key metrics on a regular basis will help you to stay ahead of the curve and be aware of any potential issues.
Set benchmarks for your own website and act quickly if the data is heading in the wrong direction.

The importance of testing and learning
Improving your website performance should be viewed as an ongoing process.
Not every change you make to your website or user experience will have an immediate impact, which is why testing and learning are so crucial for ecommerce success.
If you’ve spotted a potential issue with a site metric, don’t be afraid to try something new to try and resolve it.
For instance, let’s say you’re seeing a decline in your Conversion Rate. Why not try a new landing page headline that delivers a more compelling message to your audience?
If the new headline fixes the issue, then everyone’s a winner. If it doesn’t quite get the job done, you can try different headline copy or tweak another element of your website to resolve the problem.
Measuring these ecommerce metrics is all about identifying opportunities for improvement.
Don’t panic if a problem arises – that’s why you’re monitoring this data in the first place!
Ultimately, all of these ecommerce metrics are laddering up to the same goal.
You’re looking to increase online sales, maximise customer revenue, and run a profitable business.
Some of these metrics may fluctuate regularly, and some may remain steady over time. The key is to measure them as often as possible and as accurately as possible.
Act quickly and decisively if you spot an issue, and you’ll be on track to deliver some jaw-dropping results.